Summary
- CloudAhoy automatically segments your flight.
- Declutter by hiding irrelevant segments
- Segments’ information includes graphs
- Create your own custom segments
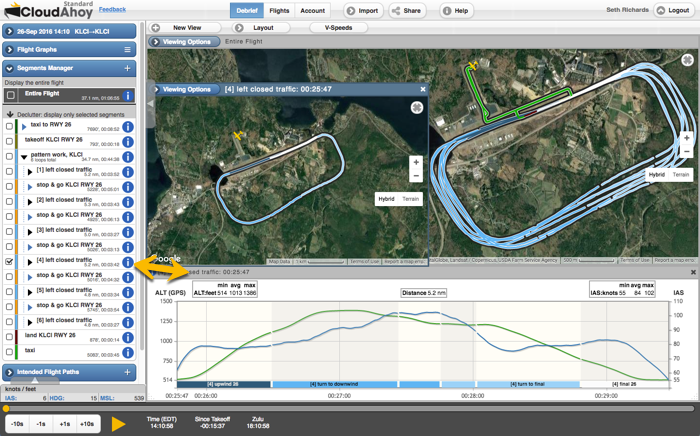
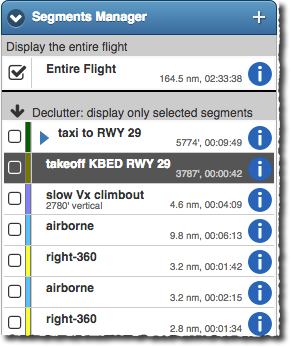
CloudAhoy automatically segments your flight and lists the segments in the Segments Manager.
- Clicking on a segment in the list zooms on the segment in the flight track display.
- Each segment lists the total time and distance flown. Example: the takeoff segment on the right shows a roll of 3787′ and 42 seconds before rotation.
- The segment with the current aircraft time has a black background.
- Some segments have additional information. Example: the slow Vx climbout segment on the right shows vertical distance travelled of 2780′.
Color
The color of the swatch next to the declutter checkbox  matches the color of the segment on the flight track display, and the segments displayed on the flight graphs. For example, 360 turns are marked with yellow on the segment list, on the 2D or 3D track, and on the flight graphs.
Hierarchy
Segments may be hierarchical, e.g., a segment pattern work that contains several left closed traffic, each containing segments like left downwind or final. You can open and close the hierarchy using the small arrows  to the left of the segment name.
Declutter
Tip
to display only one segment (for example, the final of a given traffic pattern), check the checkbox of the “Entire Flight” segment in the segment list (thus showing all segments), then click the checkbox of the segment you’d like to see.in each segment to enable/disable the display of that segment. This could be useful to focus on a specific traffic pattern.
It is often convenient to see the entire flight in one view, and one maneuver in another. An easy way to do it:
- Activate the main view.
- Display the entire flight in the main view by checking the “Entire Flight” checkbox.
- Create a new view, which shows all segments by default.
- Now you have the entire flight in one view, and the isolated selected maneuver in the main view.
For more details about decluttering, see the decluttering topic. For an example of decluttering, see Debriefing Traffic Patterns.
Flight graphs
When you display flight graphs, you may choose which segments are displayed using the Segments Manager declutter tools. See the decluttering topic for additional information.
Segment information
Each segment has an  or
or  icon, which opens up a window displaying more information, as well as relevant flight graphs.
The icon indicates that the segment is part of an approach to landing, and that the graph will include an average slope line.
If the segment contains a landing, the graph will also include a to-scale depiction of the runway. The touchdown point is indicated with vertical dashed line that’s labeled with the distance touchdown occurred from the threshold, along with the length of runway remaining after the touchdown point. The runway will contain a  section if a portion of the runway after touchdown has been omitted in the interest of space.
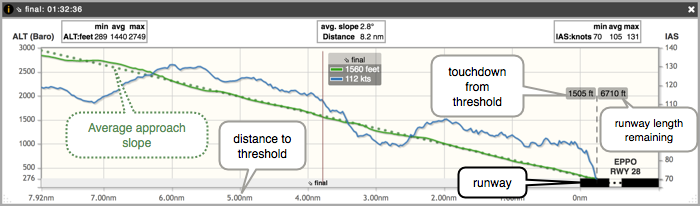
You can move and resize these windows, and you can close them. The windows are persistent between debriefs.
Custom segments
You can create your own custom segment using the  icon and moving the markers with the arrows in the timeline. You can also create the custom segments in real-time during flight by using the CFI tab of the iPad app. When a custom segment overlays a system segment, the system decides which one to give precedence to, and sometimes it uses both by building hierarchy.
Custom segment are very useful for obtaining flight profile graphs of selected areas in the flight. You can get the profile either by clicking the icon in a segment, or by using the Flight Profile panel. When you display flight profiles, only the enabled segments are shown in the graphs, and in this way you can numerically analyze selected stages of the flight, or the entire flight.
You can also edit custom segments, modifying their end points, title and color. Or you can delete custom segments.
Example: holds
Suppose you have flown several holds and want to declutter and debrief them.
- Start defining a custom segment, select end-point #1 as the one you’re defining (it’s selected by default), move the time slider to approx. the fix you held on in the first hold, then use the -10s,…,+10s buttons to get to the precise hold location.
- Select end point #2, move the timeline approx. to where point #1 is, then use the +10s button to move point #2 until you get to the starting point.
- Set the name and color, and Save.
- Likewise for other holds.
Now you can display only one of the holds, optionally with profiles.
Flight Level Changes
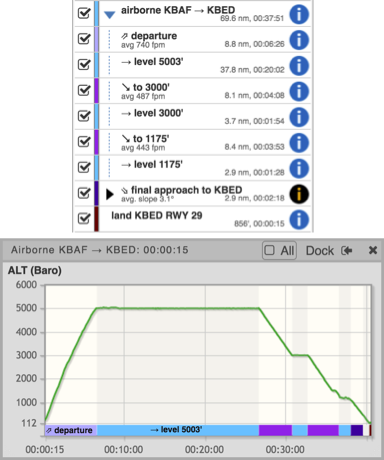
CloudAhoy analyzes all the flight level changes, and segments the flight according to these level changes. The example on the right shows a simple flight with a departure segment (at computed 740 fpm average climb rate), then level flight at 5003′, followed by two decents and level-offs, then final approach and landing. The graph shows the corresponding color-coded segments along the bottom of the graph, and segment labels where space is available.