Summary
- Select a flight graph from a menu.
- Graphs can be docked – displayed on the left panel.
- In un-docked state, graphs can be moved and resized.
- Graphs can show the same segments as the active view, or all segments in the flight.
- Graph display is persistent.
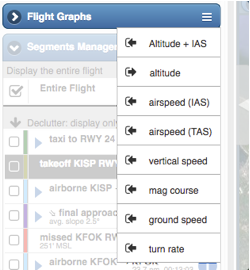
To display a flight graph, click (or tap) the menu icon on the Flight Graphs header, and select the flight graph from the list.
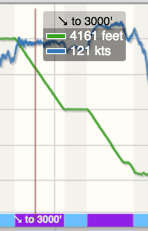 Every flight graph has a values flag visible when the current debrief time is within a segment which the graph is showing. The flag shows the label of the current segment as well as the value of each of the lines in the graph at the location of the crosshair.
The flight segments are displayed along the x-axis of the graph. The segments are color coded, using the same colors as the segments in the flight track. When space is available, the segment label is displayed for the segments as well.
By default, Flight Graphs graph only the visible segments in the active view. See here for more information about decluttering.
A flight graph can be made to show all segments in the flight by clicking the  button in the graph’s title bar.
Graphs: undock and dock
Initially a graph is displayed in the Flight Graphs section. This is called docked state.
You can undock a graph by clicking the undocking icon  . Once undocked, a graph can be moved and resized – see the illustration below. You can also dock it back in the Flight Graphs section by clicking the docking icon

To close a graph, click its X icon on the upper right, or unselect it from the menu.
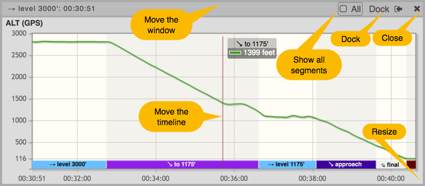 Drag the crosshair to move the timeline
Each profile has a vertical line to show the current time. You can drag the line to move the current time, which is exactly equivalent to moving the timeline’s slider – but allows for better accuracy.
Note: dragging the crosshair is currently unavailable on the iPad.
Persistence
If you are the flight’s owner (i.e., one of the pilots), each profile’s size and location is saved, and will be restored the next time you debrief the flight.
Multiple graphs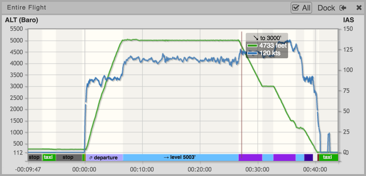
Two commonly used graphs, Altitude and IAS, can be combined into one graph by selecting “Altitude + IAS”. When this graph is selected, IAS is displayed in dashed lines.
Extended graphs
Every debriefed flight includes the standard graphs, such as altitude, VS and airspeed. If you import the flight from an aviation system such as the Garmin G1000, you have tens of additional graphs. See this.
Multi-value temperature graphs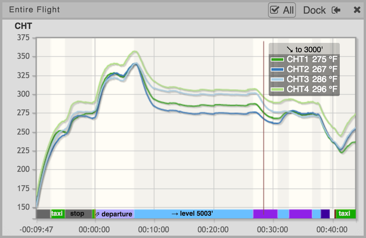
If you import data from an EFIS such as Garmin Perspective or Garmin 1000, you can display individual cylinder’s CHT and EGT graphs, or combined CHT / EGT of all cylinders. Choose CHT 1..6 or EGT 1..6 from the Flight Graphs menu to open the corresponding multi-value temperature graph.
Example
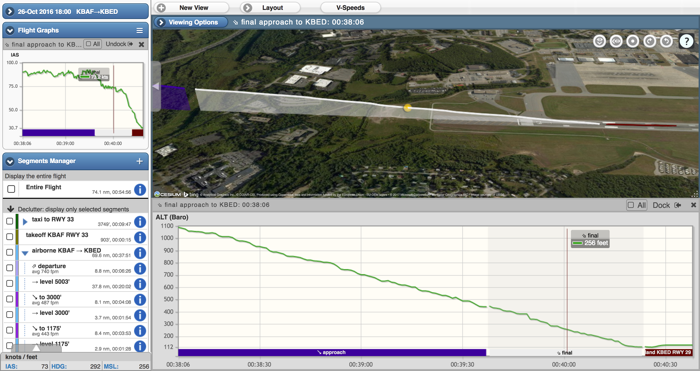
The screenshot on top was obtained by selecting only the Approach and Final segments (see here about decluttering) and displaying airspeed in docked state and altitude undocked. Such a display can help in debriefing how stabilized the approach was – the approach is the screenshot was not very stabilized.