Summary
- Display extended avionics data
- Tens of additional flight graphs
For pilots flying Garmin G1000, Garmin G3X, GRT Avionics, Avidyne or Dynon Avionics
CloudAhoy supports extended EFIS data displayed as CloudAhoy flight graphs. It allows you to focus on such things as your power settings, engine information, and navigation accuracy.
In what follows we describe G1000 graphs. The graphs from other EFIS are very similar.
I used the G1000 data of a VFR flight from KPWM to KBED on a DA 40. The flight itself was uneventful, but still it’s interesting to view the rich data.
Examples of debriefing G1000 data
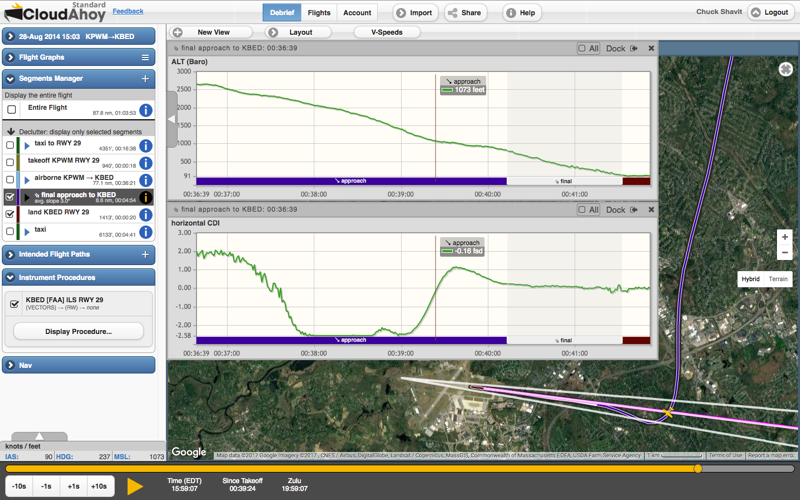
Example – Navigation, horizontal CDI: this was a VFR flight and on the approach to landing I had to follow a Citation on the right base. Even though it was a visual approach, I loaded the ILS-29 approach into the G1000. The horizontal CDI profile shows the CDI deflection as I was approaching the localizer’s center beam, then overshooting it (oops) before intercepting the center line from the other side.
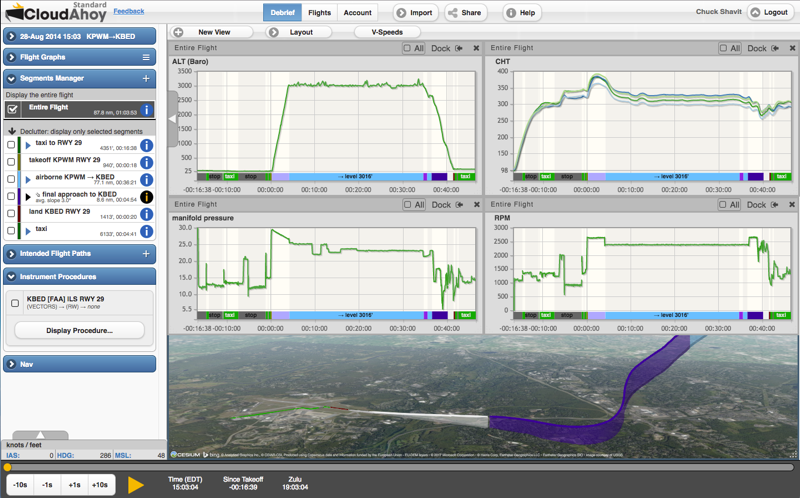
Example – Engine Data: I plotted the altitude, manifold pressure, RPM and cylinder head temperatures for the entire flight. Note the RPM=2000 during run-up, then set to max during the initial climb and during the final approach.
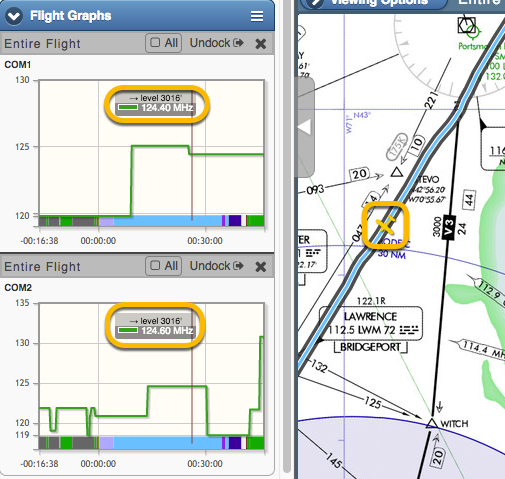
Example – Radio: in some cases it might be interesting to debrief the radio usage. The following screenshot shows my aircraft about 5 miles from Boston’s mode-C veil when I switched to Boston Approach 124.4 on the active COM1. COM2 at the time was tuned to KBED’s ATIS, 124.6.
Soon after, I switched COM2 to KBED’s tower 118.5, then after landing to KBED ground 121.7, and finally after I parked I called for fuel on 130.8.
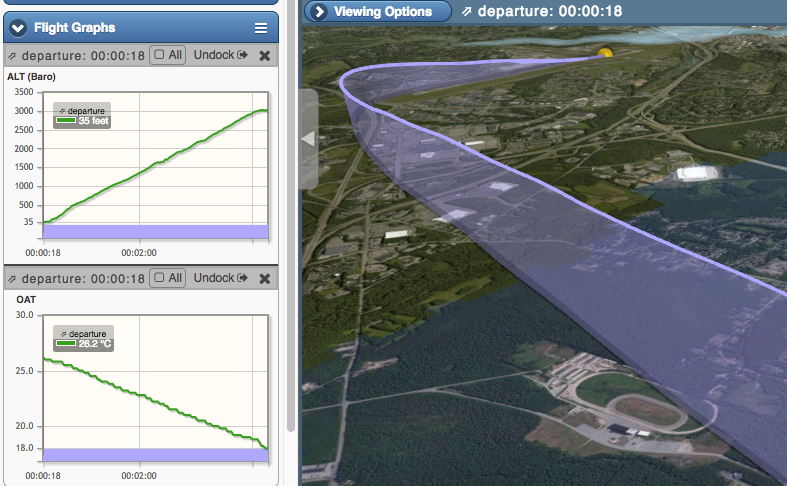
Example – Altitude vs. OAT: Here I plotted the Altitude and the Outside Air Temperature profiles of the departure climb from KPWM to my cruise altitude of 3000′. Turned out the temperature dropped at a rate of 2.7°C per 1000′.
viewing G1000 data
The combination of the rich flight data from the G1000’s avionics with the flexible graph display of CloudAhoy provides a powerful debriefing environment. You can display any number of graphs simultaneously and move their timelines in sync, or watch them change during animation. The graphs may be configured to show only those segments visible in the active view, or all segments in the flight. See decluttering for more information.
- To import G1000 flight data, see this.
- To import G3X flight data, see this.
- To import Avidyne flight data, see this.
- To import GRT flight data, see this.
- To import Dynon flight data, see this.
- To use CloudAhoy flight graphs see this.
To display a flight graph, click (or tap) the graphs  menu icon in the Flight Graphs bar. You can select a standard graph (like altitude) as well as a G1000 profile.
CloudAhoy organizes the data into groups. Read the list like you read classified ads in a newspaper: top to bottom and left to right.
Further Reading
The debrief tab
Flight graphs
Import G1000 data
Import G3X data
Import Avidyne IFD data
Import GRT Avionics data
Import Dynon Avionics data